Contents
Revision note
Tip: This lab includes fundamental concepts vital to later labs in this module, some may be revision.
Introduction to programming errors
It is hard to write secure code. Small programming mistakes can result in software vulnerabilities with serious consequences. The two main categories of software flaws are those caused by:
-
design problems: such as, a programmer not thinking through the kind of authentication required
-
implementation problems: such as, a programmer accidentally introducing a bug by using an insecure library method or trying to store too much data into a variable
Common programming errors that lead to security flaws include:
-
Memory errors and bounds checking, such as buffer overflows
-
Using input without sanitising it: this can lead to flaws such as command injection
-
Race conditions (problems caused by the timing of events)
-
Misconfigured/used access controls and other security mechanisms
-
Misuse of pointers and strings
Programming in C and Debugging Assembly
C is an important programming language. C is one of the most widely used programming languages of all time. C was designed for programming Unix, and is used for the Linux kernel, amongst many other high profile software projects. C code maps well to machine code instructions, yet is easier to maintain than assembly code. Assembly code is essentially made up of low-level instructions that get assembled into machine code instructions, which are executed by a CPU.
However, since C is a relatively low-level language, which exposes the complexity of underlying systems (such as memory management), and since it does not have all of the security features included in newer languages, programs written in C (and C++) tend to be prone to many security flaws. This makes C a good choice when studying software security, and to get an understanding of software vulnerabilities.
Hello, world!
Let’s start by writing, compiling, and running a very basic C program.
==action: Open a terminal console==.
==action: Move to a new directory for our code:==
mkdir ~/code
cd ~/code
==action: Create and edit a new file “hello.c”:==
vi hello.c
Note: Reminder: Vi is ‘modal’: it has an insert mode, where you can type text into the file, and normal mode, where what you type is interpreted as commands. ==action: Press the “i” key to enter “insert mode”==. ==action: Type the below C code:==
#include <stdio.h>
int main() {
    printf("Hello, world!\n");
}
==action: Exit back to “normal mode” by pressing the Esc key==. Now to ==action: exit and save the file press the “:” key, followed by “wq” (write quit), and press Enter==.
Tip: Alternatively if you want to copy and paste, rather than using vi, run “cat > hello.c” and paste into the terminal, then press Ctrl-D to end the file.
==action: Compile your code:==
gcc hello.c -g -m32 -o helloworld
And again with some options to make the assembly simpler to understand:
gcc hello.c -g -m32 -mpreferred-stack-boundary=2 -fno-pie -o helloworld_simplified
Note: The arguments here are the file to compile (hello.c), the “-g” flag instructs the compiler to include debugging information, which makes examining the compiled program easier, as the source code is made available from within the debugger (without requiring any reverse engineering).
Note: The “-m32” flag tells gdb to generate a 32 bit executable, which will make it more likely that your system will generate similar assembly to these examples.
Note: The “-mpreferred-stack-boundary=2” disables some stack alignment optimisations.
Note: The “-fno-pie” disables position-independent execution, which is used for layout randomisation.
Note: Finally, “-o” is used to specify what filename to output to, in this case to an executable named “helloworld”.
==action: Confirm this has generated the compiled programs “helloworld” and “helloworld_simplified”):==
ls -la
==action: Run the program:==
./helloworld
Note that in modern C, comments can be written as either
/* comment */
or
// comment
==action: Edit the file to add comments describing each line:==
// this first line of code below imports code from elsewhere,
// which is what gives us use of the printf() function
#include <stdio.h>
// this is the start of the main function,
// which is the code that starts when the program is run
int main() {
    // this line calls the printf function, and passes it
    // the string of characters "Hello, world!"
    // which it prints to the standard out (console)
    // \n inserts a new line
    // ; ends a line of code
    printf("Hello, world!\n");
// this ends the main function
}
==action: Compile and run your new code, confirming that it has not changed the behaviour of the program==.
Debugging code using GDB
A debugger is a program that can be used to test other programs, and to “debug” the program by inspecting the state of the program, while stepping through code.
Before we run GDB for the first time, we will change some configuration settings so our programs are disassembled using the Intel notation (GDB defaults to AT&T).
==action: Run:==
vi ~/.gdbinit
==action: Add the following line:==
set disassembly-flavor intel
==action: Save and close the file==.
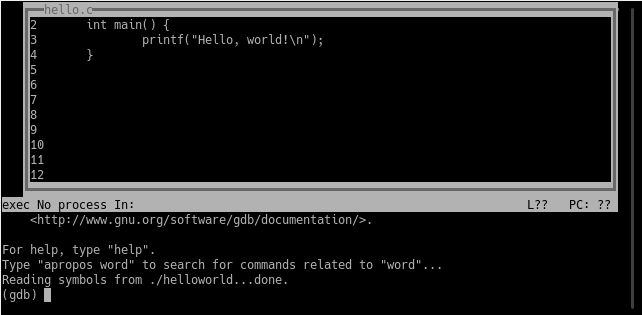
Start gdb with the “GDB Text User Interface” enabled. The GDB TUI is an interactive console interface that shows various views at once. The C source code, resulting assembly instructions, registers, and GDB commands can be displayed in separate text-based windows.
gdb -tui ./helloworld_simplified
Note: (Press Enter to scroll through the welcome messages)
The resulting view includes the original C code, and below that the interactive console, which you type commands into.
==action: Start by changing views, to also show assembly instructions:==
(gdb) layout split
The C code and assembly instructions are now both shown at once:
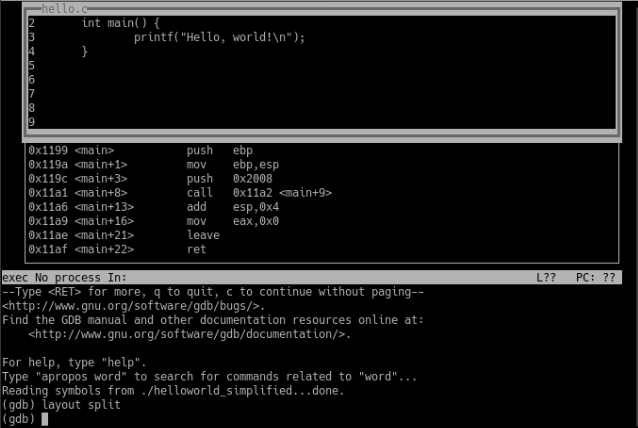
The assembly code is a very low-level representation of the program. Assembly code is close to a one-to-one representation of the actual machine code that is executed by the CPU when the program runs.
Here we can see exactly what actions the program will attempt. Although many programmers don’t bother to understand the assembly that their C code produces, these details are important for understanding certain important kinds of software vulnerabilities, such as buffer overflows.
In this very small program, the main function only involves a few instructions.
The first few instructions in the main function make up the function prologue. The function prologue sets up the stack for this function.
The call stack (or simply “the stack”) is an area of memory used to keep track of program execution (such as, remembering which code to return to after each function ends). Every time a function is called, a new stack frame is added to the stack for that function.
The stack stores for a function:
- parameters: information passed into the function
- local variables for the function (for example, strings) – note that sometimes the compiler may use registers for local variables (such as integers) rather than stack memory
- The return address (where to return execution to when the function ends)
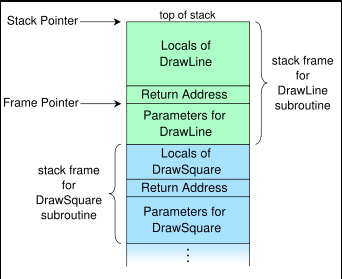 The call stack (image CC BY-SA by R. S. Shaw: http://en.wikipedia.org/wiki/File:Call_stack_layout.svg)
So, looking at the assembly for our hello world program, let’s take some time to understand the purpose of each instruction in the standard function prologue (this appears at the start of every function):
push   ebp
mov    ebp, esp
The function prologue starts by pushing the base pointer register onto the stack (saving the stack base pointer from the calling function for later). Note that the stack is a FILO (first in last out) data structure (and a “pop” instruction returns data from the top of the stack). Like a stack of dinner plates, the first one you put in is the last you get out.
Next, the mov instruction overwrites the base pointer register (ebp) with the value from the stack pointer register (esp). This sets the bottom of the new current stack frame, as stored in ebp.
EBP: base pointer - bottom of the current stack frame
The result is that the stack pointer has been moved to a lower memory address (if things weren’t interesting enough, the stack grows downward on most platforms! - So the address at the top of the stack (esp) is a lower number than at the bottom (ebp)).
ESP: stack pointer - top of the current stack frame
The next few instructions provide the actual functionality of our program, by calling printf to display our message:
push   0x2008
call   0x11a2 <main+9>
The push instruction copies the value 0x2008, placing a pointer to our string onto the top of the stack. This in effect passes the address of the string “Hello, world!”, into the function. Then calls the printf (or puts) function.
The next two instructions allow the main function to return a success value of 0, and reset the esp by adding 0x4 to it (effectively shrinking it since the stack grows downwards).
The last few instructions make up the function epilogue, which simply ends this program:
leave
ret
So to summarise:
0x1199 <main>    push   ebp           ; prologue - save base ptr
0x119a <main+1>  mov    ebp,esp       ; prologue - set new base
0x119c <main+3>  push   0x2008        ; push the msg as param
0x11a1 <main+8>  call   0x11a2 <main+9> ; call print msg
0x11a6 <main+13> add    esp,0x4       ; return the esp value
0x11a9 <main+16> mov    eax,0x0       ; function returns 0
0x11ae <main+21> leave                ; epilogue
0x11af <main+22> ret                  ; epilogue
The focus (or “fs”) command can be used to switch to focusing on a particular view for scrolling keystrokes. You can switch focus to “src” for source, “cmd” for commands, “regs” for registers, or “asm” for the assembly view (or “next”/”prev”). ==action: Switch focus to the command window:==
(gdb) focus cmd
From within the debugger you can run the program, using the command “run” (or “r”):
(gdb) run
Note: Note that the program runs, and finishes before we have a chance to investigate.
==action: Set a breakpoint, so the program pauses as soon as the main function starts:==
(gdb) break main
==action: Restart the program:==
(gdb) run
The program will pause, and the views of code will indicate the function prologue has completed and the code is sitting at line 3, the printf statement and push instruction.
The next instruction is set to push some data to the stack.
==action: View the value in that memory location: (the x command displays a value from memory, x/s prints the memory contents as a string):==
(gdb) x/s ==edit:memory_address_from_push==
==action: Now, instruct gdb to execute the next assembly instruction:==
(gdb) stepi
Note: Note that you can step through C lines using “step”, but since our whole program is one line, that would bring us to the end; so we use “stepi”, which steps one assembly instruction at a time.
The printf function is provided by the glibc libraries, which are dynamically loaded when the program started (or in this case when GDB loaded the program). This involves quite a bit of code.
==action: Enable the registers view:==
(gdb) fs asm
(gdb) layout regs
(gdb) focus cmd
Note: (Layout regs places the register view over the window you are not focused on, so this ensures you end up with the assembly and registers view).
==action: Step through the printf code by running:==
(gdb) stepi
(gdb) frame info
Note: Run stepi many times, and note the esp moves each time a function is called, and that each call has a function prologue. The ebp stays the same.
Another register you will notice changing a lot is eip, the instruction pointer. The instruction pointer refers to the location of the next instruction that the CPU will run. We will return to this very important detail later.
EIP: address of next instruction
When you have finished analysing the assembly of our hello world program, ==action: you can exit the debugger==.
(gdb) quit
Debugging main functions
Load up the un-simplified version of the program into gdb, so we can see what a main function assembly often looks like.
The main function has some extra instructions that we don’t really need to worry about most of the time, but you will see extra code in the main function used to align the stack, so here is an overview. The compiler aligns the stack pointer on a 16 byte boundary, because certain instructions’ memory access needs to be aligned that way, and it also provides a speed improvement related to caching.
This additional code is typically related to stack alignment (an optimisation around the starting position for where on the stack the values are placed), and to support position-independent executables (PIE). The __x86.get_pc_thunk.ax function is used to accommodate PIE, which means the program machine code can be loaded at any address in virtual memory and it will still be able to run. PIE means the program can support address space layout randomization (ASLR), which randomises the layout for increased security, as it makes exploitation of memory vulnerabilities more difficult (which we will cover in detail in a later topic).
0x1199 <main>    lea    ecx,[esp+0x4]
0x119d <main+4>  and    esp,0xfffffff0
0x11a0 <main+7>  push   DWORD PTR [ecx-0x4]
0x11a3 <main+10> push   ebp                 ; function prologue
0x11a4 <main+11> mov    ebp,esp             ; function prologue
0x11a6 <main+13> push   ebx
0x11a7 <main+14> push   ecx
0x11a8 <main+15> call   0x11d5 <__x86.get_pc_thunk.ax> ; pie
0x11ad <main+20> add    eax,0x2e53
0x11b2 <main+25> sub    esp,0xc
0x11b5 <main+28> lea    edx,[eax-0x1ff8]
0x11bb <main+34> push   edx
0x11bc <main+35> mov    ebx,eax
0x11be <main+37> call   0x1030 <puts@plt>   ; calls print msg
0x11c3 <main+42> add    esp,0x10
0x11c6 <main+45> mov    eax,0x0
0x11cb <main+50> lea    esp,[ebp-0x8]
0x11ce <main+53> pop    ecx
0x11cf <main+54> pop    ebx
0x11d0 <main+55> pop    ebp
0x11d1 <main+56> lea    esp,[ecx-0x4]
0x11d4 <main+59> ret
Note that a lot of the optimisation “artefacts” are mostly present in the main function, and that once the stack is aligned, subsequent function calls will be simpler, more like our simplified example above.
Variables and C
A variable is a buffer (some memory) for storing data, such as input from a user. In C, variables should be defined at the start of a function, before any other code.
==action: Create and edit a new file “variables.c”:==
vi variables.c
==action: Enter the below C code:==
#include <stdio.h>
int main() {
    int num1, num2, sum;
    num1 = 10;
    num2 = 15;
    sum = num1 + num2;
    printf("The sum of %d and %d is: %d\n", num1, num2, sum);
}
The first few lines define some variables that are Integers (int), that is, they only store whole numbers, and then assign them some values (=). The two numbers are added together (+), storing the result in the “sum” variable, and finally the result is printed.
Note that the use of printf is more complex in this example: the first argument (“The sum of %d and %d is: %d\n”) is actually a format string, which is a template used to create the text to output. The “%d” token tells printf to take the next argument and format it as an Integer (%d: integer, %f: double, %s: string). The first %d is replaced with num1, and the next num2, and so on.
For more information about printf, you may wish to refer to:
man 3p printf
or http://en.wikipedia.org/wiki/Printf_format_string
==action: Compile your code:==
gcc variables.c -g -m32 -mpreferred-stack-boundary=2 -o vars
==action: Confirm this has generated the compiled program “vars”:==
ls -la
==action: Run the program:==
./vars
Reading input and testing conditions
==action: Create and edit a new file “input.c”:==
vi input.c
==action: Enter the below C code:==
#include <stdio.h>
int main() {
    int num1, num2, sum;
    printf("Please enter a number:\n>");
    scanf( "%d", &num1 );
    num2 = 15;
    sum = num1 + num2;
    printf("The sum of %d and %d is: %d\n", num1, num2, sum);
    if(sum > 100) {
        printf("The sum is greater than 100\n");
    } else {
        printf("The sum is less than or equal to 100\n");
    }
}
==action: Compile and run your code==.
The main differences here are:
-
The inclusion of scanf, which reads user input into a variable, based on the format string. In this case, scanf reads an integer into num1, since the format string specifies “%d”.
-
The if statement, which branches the code, depending on whether the “sum > 100” condition is met. Other test conditions that could be used include “==” does it equal, “<” less than, “<=” less than or equal to, “!=” not equal to.
==action: Modify your code to have the user input three numbers, and calculate the product (multiply). Tell the user whether the product is less than 50==.
==action: Test your code:==
Question: Does your code work with the numbers: 1, 2, and 3?
Question: 1, 2, and 0?
Question: Does it work when the result is a real number, with decimal places? If not, why not?
Question: What is an integer overflow?
Question: What happens if the user enters a very very big or small number?
Question: What about if the user enters a letter?
==action: If you haven’t done so already, update your code to store the input and product in a “double” (real number), rather than using “int” (integers)==.
==action: Compile and test your code==.
Hint: you will need to change the printf and scanf format string. “%d” is used for integers (whole numbers). This link may be helpful.
Security flaws: type safety, bounds checking, and buffer overflows
As you have seen from the testing you have just completed, it is easy to make simple mistakes that result in a program misbehaving. Sometimes simple coding errors can result in more serious problems, such as introducing security vulnerabilities.
==action: Create and edit a new file “testerr.c”:==
vi testerr.c
==action: Enter the below C code:==
#include <stdio.h>
#include <unistd.h>
#include <stdlib.h>

int main() {
    char execute [15] = "ls";
    char name [10];
    printf("What is your name?\n");
    scanf("%[^\n]s", &name);
    printf("Hello %s, executing the command %s\n"
           "The files in the dir are:\n", name, execute);
    sleep(2);
    system(execute);
}
Tip: An alternative is to use the line “gets((char*)&name);” in place of the scanf line. Both versions will have similar security problems.
Tip: Technically you don’t need the ampersand (&) in the scanf format string when the variable you are writing into is an array, so newer versions may complain, if so, remove the ‘&’.
Note: The line “scanf(“%[^\n]s”, &name);” reads any input, accepting anything except a newline. “[^\n]” is a regular expression, which represents any character except \n (a newline). As specified, scanf() stores into the variable “name”.
==action: Compile your code:==
gcc testerr.c -g -m32 -mpreferred-stack-boundary=2 -o testerr
==action: Run the program:==
./testerr
Question: Can you already spot the security issue in this code?
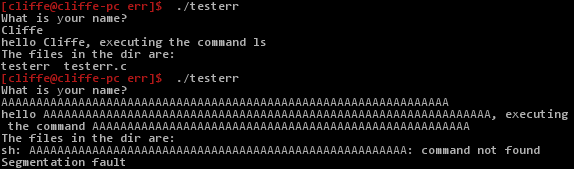
==action: Test this program, by running it a few times and try entering different inputs==.
Question: Does it work normally if you enter your own name?
Question: What happens if you enter an input that is very long?
==action: Try entering:==
AAAAAAAAAAAAAAAAAAAAAAAAAAAAAAAAAAAAAAAAAAAAAAAAAAAAAA
 Testing and breaking the program
As shown above, when you enter an input that is long, this program starts to behave incorrectly. It is even apparent from the above that the “execute” variable seems to have changed! Woah… This looks like trouble!
Tip: If you do not see this behaviour, follow the previous tip regarding using gets rather than scanf, and recompile.
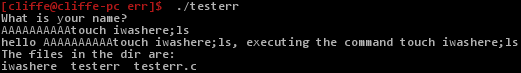
==action: Run the program again, and try entering 10 “A”s, followed by “touch hi;ls” (as shown below)==.
 Subverting the behaviour of the program
==action: Confirm you have tricked the program into creating a new file called “hi”:==
ls -la
Note: You may need to adjust the number of As, so that your command is correctly written to the “execute” variable.
At first glance the code looks innocent enough, but as a result of a potential programming mistake the user can gain control of another variable, and alter the way the program behaves.
So what is happening?
The two variables get positioned together on the stack, one next to the other. It is up to the compiler to decide which order they appear on the stack, but during my tests, they were positioned as follows:
| name | 0 | 1 | 2 | 3 | 4 | 5 | 6 | 7 | 8 | 9 | execute | 0 | 1 | 2 | 3 | 4 | 5 | 6 | 7 | 8 | 9 | 10 | 11 | 12 |
|---|---|---|---|---|---|---|---|---|---|---|---|---|---|---|---|---|---|---|---|---|---|---|---|---|
| l | s | \0 |
Note that in C, a string is simply an array of characters, so name[0] refers to the first letter, name[1] the second and so on. A C string is terminated with a ‘\0’ character (null). So for example, as shown above, the value we set for the execute variable is followed by a null character.
If the user does as expected and just enters a short name, our variables contain values such as:
| name | 0 | 1 | 2 | 3 | 4 | 5 | 6 | 7 | 8 | 9 | execute | 0 | 1 | 2 | 3 | 4 | 5 | 6 | 7 | 8 | 9 | 10 | 11 | 12 |
|---|---|---|---|---|---|---|---|---|---|---|---|---|---|---|---|---|---|---|---|---|---|---|---|---|
| C | l | i | f | f | e | \0 | l | s | \0 |
However, our code did not instruct scanf how many characters to read from the user, so scanf() will obligingly read as many characters as the user enters, and writes them into the name buffer. Our example of entering 10 “A”s, followed by “touch iwashere;ls” results in the simplest form of a buffer overflow. A buffer overflow is when a buffer overflows into other memory. In this case one buffer overflows into an adjacent variable.
The result is:
| name | 0 | 1 | 2 | 3 | 4 | 5 | 6 | 7 | 8 | 9 | execute | 0 | 1 | 2 | 3 | 4 | 5 | 6 | 7 | 8 | 9 | 10 | 11 | 12 |
|---|---|---|---|---|---|---|---|---|---|---|---|---|---|---|---|---|---|---|---|---|---|---|---|---|
| A | A | A | A | A | A | A | A | A | A | t | o | u | c | h | h | i | ; | l | s | \0 |
And now from the printf() call on line 7:
-
printing name gives us “AAAAAAAAAAtouch iwashere;ls”, since execute[11] is the first null character since the start of name
-
printing execute gives us “touch hi;ls”
The ability to overwrite data that the programmer does not think the user can control can result in massive security consequences. In this example, the user can subvert the behaviour of the program to execute any command (within some length constraints).
==action: Confirm this using GDB:==
echo "Bob" > test-input1
echo "AAAAAAAAAAtouch hi;ls" > test-input2
echo "AAAAAAAAAAAAAAAAAAAAAAAAAAAAAAAAAAAAAAAAAAAAAAAAAAAAAAAAAAAAAAAAAAAAAAAAAAAAAAAAAAAAAAAAAAAAAAAAAAAAAAAAAAAAAAAAAAAAAAAAAAAAAAAAAAAAAAAAAAAAAAAAAAAAAAAAAAAA" > test-input3
gdb -tui ./testerr
(gdb) layout split
(gdb) fs cmd
(gdb) break main
==action: Debug the program, feeding in out test input:==
(gdb) run < test-input2
==action: Step into the code (to the next line of C code), setting the local variables:==
(gdb) step
==action: Print the value and then the memory address of the execute variable:==
(gdb) print execute
(gdb) print &execute
==action: Display the value stored at that memory address (the GDB x command), and output in the form of a string (/s):==
(gdb) x/s ==edit:0xffffd211==
Note: (Where ==edit:0xffffd211== is from the output from the above “print &execute” command)
==action: Print the memory address of the name variable:==
(gdb) print &name
==action: Use a scientific (numerical system mode) calculator to confirm that:==
Note: (hex) ==edit:0xffffd211== - ==edit:0xffffd207== = 10 (base 10) (or hex 0xa).
Note: (Where ==edit:0xffffd207== is from the output from the above “print &name” command)
Hint: in another terminal tab or window, run “kcalc &”. Ctrl+Shift+N in Konsole
Note: Therefore, you can conclude the two buffers are in adjacent locations of memory, and 10 bytes are reserved for the name buffer, as expected.
==action: Continuing from above, step into the code (the next two lines of C code) that reads the input:==
(gdb) step
(gdb) step
==action: After the input has been processed, re-display the contents of the execute variable:==
(gdb) print execute
(gdb) x/s ==edit:0xffffd211==
Note: (Where ==edit:0xffffd211== is from the output from the previous “print &execute”)
(gdb) print name
(gdb) x/s ==edit:0xffffd207==
Note: (Where ==edit:0xffffd207== is from the output from the previous “print &name”)
Stack smashing buffer overflows
In the previous example the data overwritten was another variable, changing the behaviour of the program. It is also possible to overwrite the return pointer that is stored on the stack as part of the function prologue, so that we overwrite the EIP register and therefore change the next code that is executed, effectively making the program jump to executing a different set of instructions. This type of attack is known as a stack smashing buffer overflow and is one of the most common and critical kinds of software vulnerabilities.
==action: Continuing from above:==
(gdb) layout regs
(gdb) disable breakpoints
(gdb) run < test-input3
Note: When prompted whether to restart the program, select yes.
Program received signal SIGSEGV, Segmentation fault.
0x41414141 in ?? ()
Our very long input has crashed the program. Often a stack smashing buffer overflow can result in crashing the program (causing a segmentation fault). However, sometimes a far worse result can occur.
==action: Read the current value of the EIP register:==
(gdb) print $eip
$10 = (void (*)()) 0x41414141
As we can see, we have overwritten EIP with 0x41414141, which is a good sign that the program is vulnerable to further exploitation, since 41 is the hexadecimal ASCII representation of the letter ‘A’ (65 base10), which is what our input was made up of. So we did manage to write over the stack containing the EIP to restore!
Note: As we will cover in a later lab, the ability to modify the EIP register often provides an attacker with the keys to the kingdom! As an attacker, we would aim to overwrite it with an address that points to code that we want to run.
Note: Since 0x41414141 does not contain valid code, the program will crash with a segmentation fault.
(gdb) x/s ==edit:0xffffd211==
Fixing the code
Programming languages such as C are not (strongly) type-safe; that is, it is possible to write any type of data such as integers or characters into any area of memory. Also these programming languages do not provide any automatic bounds checking to ensure that data is only written into the memory that has been allocated for specific variables. These issues have led to higher-level programing languages, such as Java, including some type safety and bounds checking to avoid some of these security problems. However, there are many other design and programming mistakes that can lead to software vulnerabilities, and C and C++ are important, often highly efficient, and still widely used languages.
The vulnerability in this specific example code is caused by the incorrect use of scanf() or gets() (if you used the alternative code provided above).
Warning: The gets() function is never safe to use, it does not perform any bounds checking.
Note: It is possible to safely use scanf(), by specifying the length of the buffer in the format string. For example “%31[^\n]” would read up to 31 characters.
==action: Make a copy of the code:==
cp testerr.c testerr_fixed_scanf.c
==action: Edit the code:==
vi testerr_fixed_scanf.c
==action: Edit the new copy, to fix the security problem by adding a length to the scanf() call==.
==action: When you believe you have fixed the issue save your changes to the file (Esc, “:wq”)==.
==action: Compile your code:==
gcc testerr_fixed_scanf.c -g -m32 -o testerr_fixed_scanf
==action: Test your changes, with a valid, and an invalid input (try a long string)==.
Note: If there are problems, edit and recompile the code until the program is secure.
Hint: If your code is still overwriting the execute variable (and execute ends up empty), remember that you need to allow for an extra character for the terminating null (\0) character.
Note: It is recommended to use fgets(), which accepts the length of text to read as a parameter.
From the man page (“man 3 fgets”):
char *fgets(char *s, int size, FILE *stream);
Note: “fgets() reads in at most one less than size characters from stream and stores them into the buffer pointed to by s. Reading stops after an EOF or a newline. If a newline is read, it is stored into the buffer. A terminating null byte (‘\0’) is stored after the last character in the buffer.”
==action: Make a copy of the code:==
cp testerr.c testerr_fixed_fgets.c
==action: Edit the code:==
vi testerr_fixed_fgets.c
==action: Edit the new copy, to fix the security problem by adding a length to the scanf() call==.
==action: When you believe you have fixed the issue save your changes to the file (Esc, “:wq”)==.
==action: Compile your code:==
gcc testerr_fixed_fgets.c -g -m32 -o testerr_fixed_fgets
==action: Test your changes, with a valid, and an invalid input (try a long string)==.
Note: If there are problems, edit and recompile the code until the program is secure.
Introducing CTF challenges for this module
In this module, we are using a capture the flag (CTF) approach to marks for lab challenges. Some weeks you will find some programs in your home directory (under a challenges directory) – and other weeks we will explain other approaches.
==action: Browse the challenges directory==
ls /home/==edit:username==/challenges
Note: When you run the program it will give you instructions and hints on how to solve the challenge.
==action: Run the challenge (after changing to the directory):==
cd ~/challenges/Ch2_03_IntOverflow
./Ch2_03_IntOverflow
Note: The ~ (tilde symbol) represents your home directory.
Note: You can apply the techniques you have learned above (and in this case some reading about integer overflows) to solve the challenge, to determine the password that will provide you with a flag.
Flag: Solve the CTF and submit the flag to Hacktivity.
Conclusion
At this point you have:
-
Learned how to understand C code, write simple C programs, and compile C into executable programs using GCC
-
Learned some foundations of Assembly language, and interpreted machine instructions
-
Used GDB to debug C code, stepping through code and viewing the assembly code and registers
-
Caused some buffer overflows
-
Written some C code to fix the issues in our example vulnerable software, using scanf and fgets securely
Well done!