Contents
Introduction
This lab covers the tricks and techniques used by malware authors to make it difficult for analysts to understand what a given malware sample is actually doing.
At this point in the module, you have learned about and applied both static and live analysis techniques to gain understanding of compiled binary programs, including live malware samples. The anti-reversing techniques covered in this lab can make both live and static analysis significantly more difficult.
This lab will explore three main categories of anti-reverse-engineering techniques:
- Anti-debugging - Techniques to detect and evade debuggers
- Anti-disassembly - Methods to mislead disassemblers and decompilers
- Code obfuscation - Approaches to make code logic harder to understand
It is common for malware samples to check whether a debugger is attached or if the program is running in a virtual machine. When detected, the program may either immediately exit or change its behavior to something more innocuous. In this lab, you will learn how malware that changes behavior based on its environment functions, and how it can be analyzed.
Disassemblers are another category of tool in the analyst’s toolkit that can be directly targeted. This lab covers some of the ways in which programs can be written to intentionally mislead the disassembler, leading to incorrect high-level C code interpretations of the assembly instructions contained within the executable.
Finally, you will explore code obfuscation techniques, including polymorphic and metamorphic malware design as well as the use of executable packers.
The techniques described in this lab are not only used for malicious purposes. Legitimate software products may also use anti-reversing techniques to protect their intellectual property or mitigate against piracy.
This lab contains twelve challenges where reverse-engineering has been obfuscated through the use of anti-disassembly, anti-debugging, and packing techniques. These challenges are more complex than those you completed in previous weeks and will advance your dynamic analysis skills to the next level. Hints and tips can be found at the end of the lab sheet.
Have fun!
Environment Identification
To impede live analysis, malware samples often follow a two-step process:
- Environment Detection - Identify whether the program is running within an analysis environment:
- Is the program running in a VM or sandbox?
- Is a debugger attached?
- Behavior Modification - Modify program runtime behavior:
- Perform unsuspicious activity, OR
- Exit immediately
There are numerous ways in which a program can inspect its environment to determine whether the process is under analysis.
Am I within a Virtual Machine or Sandbox?
Virtual Machines (VMs) are commonly used by malware analysts to run malware samples in a sandboxed environment. Virtual machines often leave footprints in the form of artifacts on the system that can be inspected by a running program, including:
- Network Interface Cards (NICs):
- Default MAC addresses associated with virtualization providers
- Virtualized network adapters
- Hardware characteristics:
- Single CPU core (sometimes)
- Limited memory configurations
- System artifacts:
- Presence of registry keys specific to virtualization
- Use of virtual devices
- Manual inspection of memory contents
For specific artifact examples for commonly used virtualization providers, see this comprehensive guide.
The Malware Behaviour Catalog (MBC) project provides a framework for understanding malware behavior. Review the entry on various methods of Virtual Machine Detection.
One interesting approach found in the WebCobra malware sample involves checking the titles of open windows and comparing them to a list of title strings used within popular analysis tools.
Is there a debugger attached?
There are several techniques that a running program can use to identify whether it is currently being debugged:
Windows API Functions
- IsDebuggerPresent() - Checks if a debugger is attached to the current process
- CheckRemoteDebuggerPresent() - Checks if a debugger is attached to a remote process
Linux Process Inspection
- Parent process inspection using Linux’s procfs:
- Check
/proc/<pid>/statusfor process information - Compare the PPid value against known debugger names (e.g., ‘gdb’)
- Check
Memory Structure Analysis
- Manual checking of data structures in memory:
Breakpoint Detection
- Scan executable code for
0xCC(the INT3 breakpoint instruction) - Run a checksum on the executable code:
- This mitigates against patched code as well as
0xCCdebugger instructions
- This mitigates against patched code as well as
Timing-Based Detection
- Timing-based checks:
- Is the program running slower than it should?
- Perhaps a debugger is halting execution…
For a comprehensive overview of debugger detection methods, review the Debugger Detection entry in the Malware Behaviour Catalog.
More Anti-Debugging Techniques
Debuggers in Linux use the ptrace() system call to “trace” (observe and control) another process. A running program can only have one tracer at a time. If you attempt to attach a debugger to a process that is already being traced, you will get an ‘Operation not permitted’ error.
Malware authors can leverage this limitation by calling ptrace() on their own process, preventing other debuggers using ptrace() from attaching to the process.
This approach can be bypassed using several methods:
- LD_PRELOAD technique: Use a modified version of the ptrace() function loaded via
LD_PRELOADenvironment variables - Code patching: Break and jump past the ptrace() call during execution
The following CTF challenges are related to the environment identification and anti-debugging techniques described above, with hints provided at the end of the lab sheet:
-
AntiDbg_BypassPtrace
-
AntiDbg_Int3Scan
-
AntiDbg_SigtrapCheck
-
AntiDbg_SigtrapEntangle
-
AntiDbg_SigtrapHijack
-
AntiDbg_TimeCheck
Anti-Disassembly Techniques
Another approach to thwarting analysis is to write programs in a way that attempts to mislead the disassembler, leading to an incorrect reconstruction of assembly code from the program’s binary machine instructions. This is known as disassembly desynchronization.
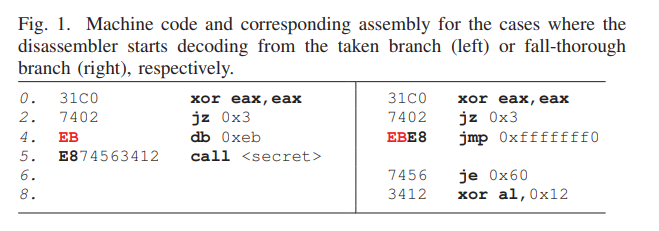
The following technique, described by Kargen et al (2022), impacts disassemblers that parse conditional statements from the fall-through branch (i.e., the else condition) before parsing the taken branch (i.e., the if condition). This manipulation of the disassembler’s parsing mechanism results in valid but incorrect instructions being produced.
These techniques can be used to hide real instructions, such as function calls. This can be achieved by injecting specifically crafted data bytes into the program and using “fake” branches that always resolve in one direction.
An example of this mechanism can be seen in Figure 1 below.
 Example of anti-disassembly technique showing fake branch and hidden function call
How the Technique Works
-
Create a “fake” branch: A condition is created that always resolves in one direction - a jump to the ‘hidden’ function call.
-
Use XOR for zero result: As you may recall, performing an XOR instruction with the same operands always results in 0. In this example, the contents of the eax register are XOR’d with itself, which always results in 0. This is immediately followed by a JZ instruction (jump if zero) which jumps to the secret() function call.
-
Insert crafted junk data: Specifically crafted data bytes are inserted into the program. Since the program always jumps at line 2, this data byte will never be reached during program execution. The significance of using the value
0xEBwill become clear shortly. -
Include hidden function call: The function call to secret() on line 5 is included, which will be hidden at decompilation.
Recursive decompilers that resolve the fall-through condition (which is never actually taken) first will misinterpret the above example. Can you see what has happened in Figure 1?
==hint: Think about the problem, then scroll to the next section for an explanation.==
What happened?
The parser has interpreted the 0xEB (data byte) and the 0xE8 (first byte of the call command) as 0xEBE8 - a jmp instruction!
All of the following ‘commands’ that have been parsed incorrectly are parts of the secret call (0xE874563412) misinterpreted as a series of assembly instructions (0xEBE8, 0x7456, 0x3412).
Similar techniques can be applied at the decompiler level to trick it into producing incorrect high-level code representations of assembly instructions.
The following CTF challenges are related to the anti-disassembly techniques described in this section, with hints at the end of the labsheet:
-
AntiDis_FakeCond
-
AntiDis_FakeMetaConds
-
AntiDis_InJmp
Packing and Code Obfuscation Techniques
Another approach to making analysis more difficult is to use code obfuscation techniques to make the program logic harder to understand.
Common Obfuscation Approaches
- Renaming variables and functions - Replace meaningful names with cryptic ones
- Obfuscating data - Encrypt or encode data to hide its purpose
- Obfuscating data access - Make data access patterns more complex
Hands-On Example
Here is an example of a web tool that obfuscates JavaScript using these techniques.
==action: Open the web page.==
==action: Experiment with different code inputs.==
==action: View the obfuscated code in the ‘output’ tab.==
Legitimate vs. Malicious Use
Legitimate tools such as packers and code minifiers have the intended purpose of reducing the size of programs for transmission across the network. However, these tools were historically adopted by malware creators to obfuscate both manual analysis and automated malware detection.
The UPX packer has historically been one of the more popular packing tools used by malware for obfuscation. As a result, the inclusion of UPX headers in a program is often detected by antivirus software. Tigress is another popular tool used to obfuscate C code.
Advanced Techniques
These ideas are taken further with polymorphic and metamorphic malware design. These concepts are discussed in detail in the Mechanisms of Polymorphic and Metamorphic Viruses paper by Li et al. (2011), accessible with your university account.
CTF Challenges Hints and Tips
The focus of this week is to bypass techniques that malware creators have used to prevent reverse-engineering of their code. Feel free to use Ghidra alongside GDB to combine both static and dynamic analyses.
Tip: Remember there is often more than one way to solve each challenge, so don’t be too focused on doing it “the right way” this week. Anything is valid, as long as you get the flag.
Here are some tips to help you find the flags:
AntiDis_FakeCond
Hint: Disassemble and analyse the code in Ghidra.
AntiDis_FakeMetaConds
Hint: This challenge was designed for IDA Pro, but can be done with Ghidra. Work through the main() function to find a hardcoded hex value. There are a couple of arithmetic operations performed on it. Take them into consideration when working out the password.
AntiDis_InJmp
Hint: The password can be found when you analyse the code in Ghidra.
AntiDbg_BypassPtrace
Hint: As with the challenge above, use ‘jump’ to bypass the bad code that stops you from debugging.
AntiDbg_Int3Scan
Hint: Disassemble and analyse in Ghidra. Work backwards through the code to find the password.
AntiDbg_SigtrapCheck
Hint: This one is pretty straightforward. You can use ‘jump’ to skip function calls. The rest is standard.
AntiDbg_SigtrapHijack
Hint: The handler() function does not get executed, so you need to force it to run.
Hint: In GDB, set a breakpoint in main() and one in handler().
Hint: Run the program. When it stops in main(), jump to handler().
ParamsRegs
Hint: Run the program in GDB, put a breakpoint just before the function of interest is called. Check each of the parameters.
ParamsStack
Hint: Same as above, but check what is pushed to the stack instead.
Conclusion
At this point you have:
- Used self-directed learning to understand different techniques used by malware creators to thwart reverse-engineering
- Gained practical knowledge on how to bypass anti-disassembly, anti-debugging, and packing techniques
- Solved practical CTF challenges and found 12 more flags!
Tip: Well done!
Some of these challenges were quite tricky and required using a combination of tools and techniques learned in previous weeks. Fantastic work!